
 Jovis AI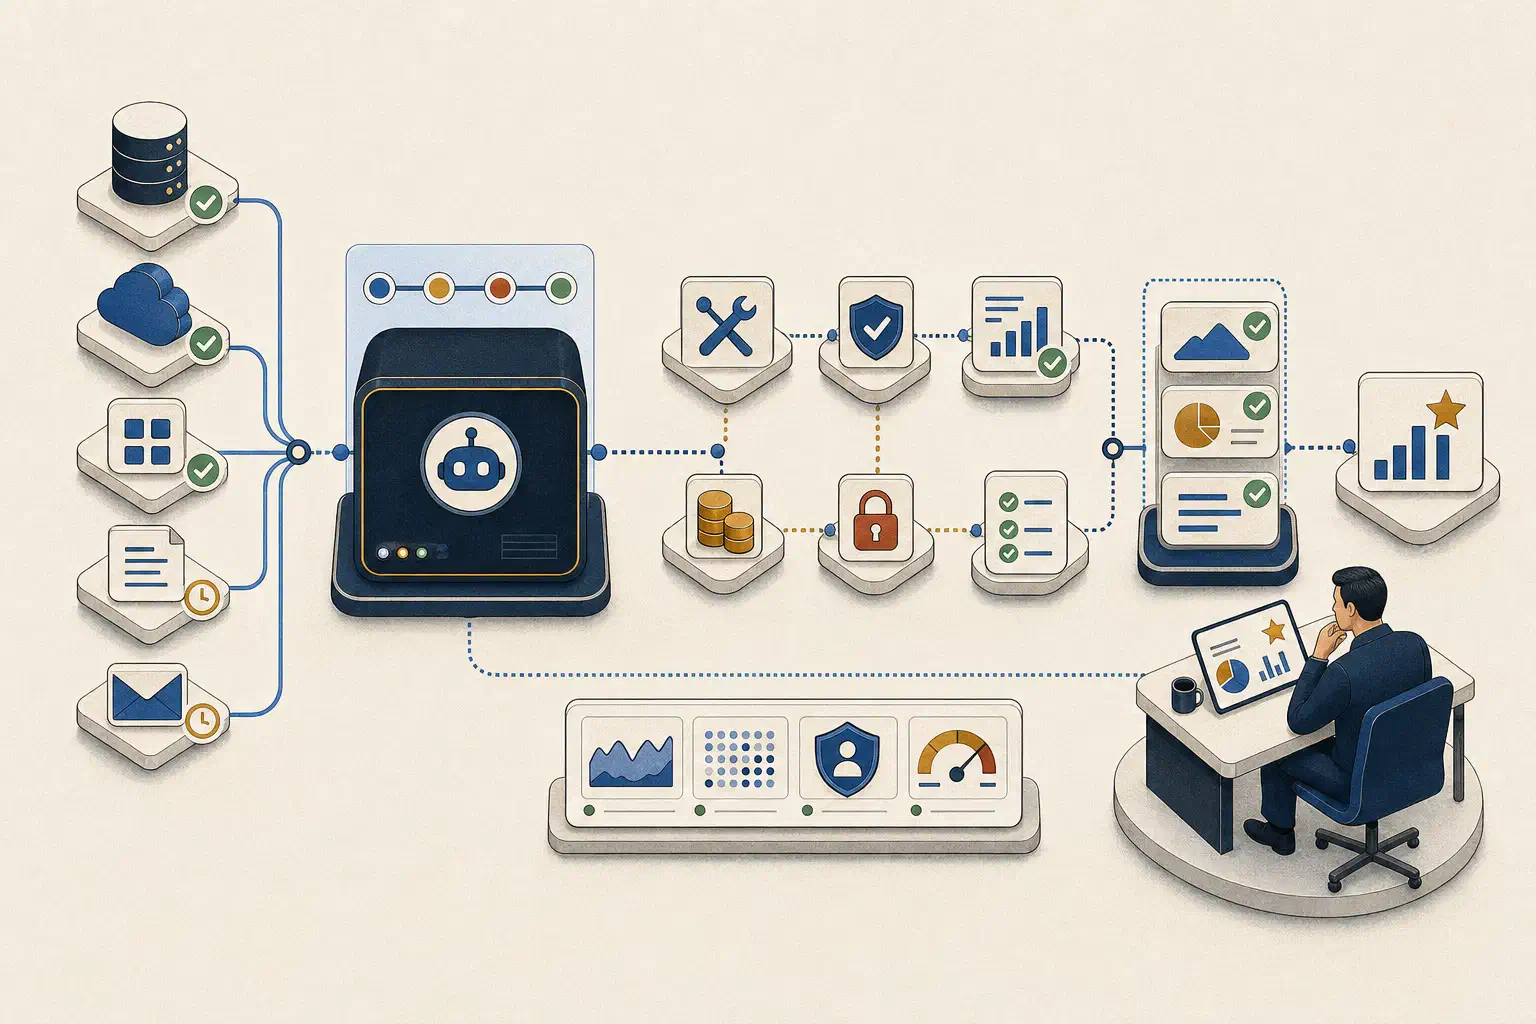
AI agent observability is the ability to reconstruct what an agent did, which business data and tools it used, which controls applied, what result it produced, and whether that result helped complete the intended job.
That is a wider remit than model monitoring. An agent can return a fluent answer with low latency and no application error while still using yesterday’s pipeline snapshot, applying the wrong definition of an active customer, or omitting the records a manager needed to inspect. For agents working with business data, a green infrastructure dashboard does not prove that the workflow is healthy.
The practical goal is not to record every token. It is to preserve enough context to answer three questions:
- What happened in this run?
- Was the result allowed, supported, and useful?
- What should an owner change when the answer is no?
Start with an observability contract for the job
Monitoring becomes vague when the agent’s job is vague. Before choosing a tracing platform or dashboard, write the production contract in one sentence.
For example:
Every Monday, identify late-stage opportunities expected to close this month that show a material risk signal, prepare the supporting CRM evidence for the regional revenue manager, and refuse records outside that manager’s scope.
That contract names the user, cadence, population, output, evidence requirement, and access boundary. It also tells the team what a successful run means.
This is the production counterpart to building an AI agent around one narrow, recurring job. If the contract only says “answer questions about our data,” the operations team will struggle to distinguish a bad answer from an unsupported request.
Turn the contract into a small set of service objectives:
- Completion: Did the run produce the required brief or a clear explanation of why it could not?
- Correct scope: Did it use the right account cohort, period, and user boundary?
- Evidence: Can a reviewer inspect the records behind each material finding?
- Freshness: Were the sources current enough for the decision?
- Usefulness: Did the owner review, act on, dismiss, or correct the result?
These objectives are more informative than a single “agent success rate.” A completed run with stale data is not a success. Neither is a technically correct answer that arrives after the meeting it was meant to support.
Trace the full run, not only the model call
A production trace should follow the request from the user’s identity to the final business outcome. The exact schema will vary, but the following events give an operator a workable path through most business-data agents.
| Trace stage | What to capture | Question it should answer |
|---|---|---|
| Request | Run ID, user or workload identity, workspace, job, timestamp | Who or what started this work? |
| Configuration | Agent, prompt, model, tool, policy, and definition versions | Which system behavior was deployed? |
| Source access | Source name, authorized scope, freshness, query or retrieval reference | Which business state did the agent see? |
| Tool execution | Tool, sanitized parameters, duration, retry count, status | What operation did it request, and did it work? |
| Policy decision | Rule version, allow or deny result, approval reference | Why was an access or action decision made? |
| Evidence assembly | Record or passage references, coverage, missing sources | What supports the material claims? |
| Response | Completion state, limitations, output reference | What did the user receive? |
| Review and outcome | Accepted, corrected, dismissed, escalated, or acted on | Did the workflow help with the job? |
OpenTelemetry’s GenAI semantic-conventions project now defines common spans, metrics, and events for generative-AI clients and related systems. Adopting portable telemetry is sensible, but a technical convention cannot supply your business-specific dimensions. “Qualified pipeline definition version” and “forecast region” still have to come from the workflow you operate.
Do not rely on a final response log to reconstruct the run. If the agent queried three sources, retried one tool, received a partial result, and then wrote a confident summary, the missing middle is where the incident lives.
Monitor five layers of production health
1. Runtime reliability
Start with familiar service measures: run volume, latency, error rate, timeouts, retry count, tool availability, model usage, and cost per completed job. Track these at both run and dependency level.
The denominator matters. “Average cost per request” can look stable while the number of abandoned runs rises. Pair resource use with a useful outcome such as cost per completed weekly brief or latency to a reviewable result.
Watch for loops and unusual tool sequences. A sharp increase in steps per run may signal a changed tool schema, an ambiguous instruction, or a source that now returns incomplete data. Set a hard execution limit in addition to an alert; observation alone will not stop a runaway process.
2. Data and semantic health
Business-data agents inherit failures that ordinary application monitoring may miss:
- a synchronized CRM table is hours behind its stated freshness target;
- a required field is suddenly null for one region;
- an API changes an enum value;
- an indexed policy document is superseded but still retrievable;
- finance and customer success use different renewal definitions;
- a join drops newly created accounts with no activity record.
Record the source snapshot or query reference, extraction time, schema version, and important definition version with the run. Then monitor freshness breaches, schema changes, missing-field rates, cohort-size anomalies, and conflicts between authoritative sources.
This is why trusted AI answers need visible sources and definitions. The agent’s wording may not change when the data contract breaks. Your telemetry has to notice.
3. Authorization and action health
Count denied requests, approval requests, expired approvals, policy failures, and attempts to use unavailable tools. Segment them by agent version, job, user role, source, and action class.
A rise in denials may mean the controls are working. It may also mean a new starter question invites users to ask for records they cannot access. The event needs enough context to tell the difference without copying sensitive business data into a monitoring system.
The OWASP AI Agent Security Cheat Sheet recommends logging tool calls and outcomes, policy and approval metadata for high-risk actions, abnormal invocation patterns, and authorization results. It also warns that sensitive data can leak into logs. Treat redaction, retention, and access to telemetry as part of the permission design, not an afterthought.
4. Answer and evidence quality
An HTTP success code says nothing about whether the brief is supported. Sample production runs against task-specific checks such as:
- every material claim has a valid record reference;
- the cited record supports the claim;
- the requested period and segment remain consistent;
- missing sources are disclosed;
- fact and hypothesis are labeled separately;
- the answer does not claim completeness after a partial tool failure.
Use deterministic checks where possible. A test can verify that returned account IDs fall within the user’s region or that every risk item carries an evidence reference. Use human review for judgment calls such as whether a summary is complete enough for a forecast conversation.
The article on practical AI governance for business data teams provides the ownership layer: someone must decide which failures matter and who can change the workflow.
5. Business usefulness
The last mile is often absent from agent dashboards. Capture a small, explicit outcome vocabulary:
- reviewed and accepted;
- corrected before use;
- dismissed as irrelevant;
- escalated for more evidence;
- action assigned;
- not reviewed before expiry.
Do not turn one click into a sweeping ROI claim. These signals tell you whether the workflow is finding useful work and where to investigate further. A brief that managers repeatedly ignore may have perfect uptime and poor product fit.
Connect this feedback to the run and its configuration version. That lets the team ask whether a new definition reduced corrections or whether a prompt change produced shorter answers that reviewers found less useful. It also gives AI a clear place in the company’s operating model: the workflow has an owner, a review habit, and a route for improvement.
Do not log the whole business by default
Full prompts, retrieved records, tool results, and final answers are convenient for debugging. They can also duplicate customer data, employee information, commercial terms, secrets, and restricted fields in a system with a different retention and access model.
Prefer structured metadata and references over unrestricted payload capture. Store a record identifier, source, version, field classification, and result status when that is sufficient. Redact or tokenize sensitive values before telemetry leaves the execution boundary. Restrict who can open detailed traces, set retention by data class, and log access to the observability system itself.
For high-consequence incidents, teams may need a protected evidence store with narrower access and longer retention than the general metrics platform. The right design depends on legal, security, privacy, and business requirements; involve the appropriate specialists rather than assuming that more logging is always safer.
Build dashboards around decisions and owners
Avoid one giant dashboard. Create views for the people expected to respond.
The workflow owner needs completion, review outcome, correction reasons, missing-evidence patterns, and changes by agent version.
The data owner needs source freshness, schema changes, cohort anomalies, definition versions, and failed queries.
The platform owner needs latency, errors, retries, model and tool usage, cost, and dependency health.
The security owner needs denials, unusual tool sequences, sensitive-action requests, approval failures, and access to restricted trace details.
Alert only when an owner has a defined response. A source freshness breach may pause the scheduled brief and notify the data owner. Repeated tool timeouts may open an incident for the platform team. A rise in reviewer corrections may trigger a sampled quality review rather than paging someone at midnight.
NIST’s AI Risk Management Framework Core calls for monitoring system behavior in production and for post-deployment plans that cover user feedback, override, incident response, recovery, and change management. The useful operational lesson is that a metric without a response path is inventory, not control.
Use one run as the unit of incident review
When a result is disputed, begin with the run ID and reconstruct the chain:
- Confirm the user, job, and deployed versions.
- Check source freshness, definitions, and authorized scope.
- Inspect tool calls, retries, partial results, and policy decisions.
- Compare the evidence packet with the final claims.
- Identify the failing layer: source, definition, connection, tool, policy, instruction, model, or review process.
- Add the incident to a regression set and verify the fix against comparable runs.
Do not solve every problem with a prompt change. A stale warehouse view needs a data fix. An over-broad tool needs a policy or interface fix. An alert nobody owns needs an operating-model fix.
A 30-day implementation sequence
Week 1: define the contract
Choose one production or near-production job. Name the owner, expected outcome, source boundary, evidence requirement, and failure behavior. Assign service objectives and zero-tolerance events.
Week 2: instrument the trace
Create a stable run ID and connect request, configuration, sources, tool calls, policy decisions, evidence, and response. Add redaction and retention rules before capturing payloads.
Week 3: add quality and outcome signals
Implement two or three deterministic checks and a sampled human review. Give the business owner a small set of outcome labels that take seconds to record.
Week 4: rehearse failures
Stale a source, revoke a permission, break a tool, change a definition, and return a partial result. Confirm that the right person can find the run, understand the failure, and take the documented response. Turn each rehearsal into a regression case.
At the end of the month, the team should be able to explain a failed run without assembling screenshots from five systems. That is a more credible readiness test than the number of charts on an observability dashboard.
Jovis provides a governed workspace for agents that use approved live business sources, grounded answers, and recurring workflows. If you are evaluating Jovis, bring one recurring job and use the trace model above to test whether your team can inspect and operate the full path from question to decision.